Updated September 6, 2023, at 9:30 PM
Every four years, American investors bear witness to the thrill of a new presidential election. Donkeys, elephants, bulls, and bears overtake the news of the day. Polls are taken, flags are waved, and signs are staked in driveways from sea to shining sea.
Every election has had its share of surprises and uncertainty. Still, the 2020 election has been further compounded by the effects of COVID-19, which has served to heighten the tension and polarization that accompanies election season.
But what does this all mean for you, your clients, and their investment plans?
Investment Returns During Election Years
One of the top concerns of investors is the volatility surrounding the election itself. A 2020 survey by Hartford funds found that 67% of respondents are concerned that the presidential campaign will increase market volatility leading to election day. No surprise there. After all, why wouldn’t it? We’re talking about electing the leader of the free world!
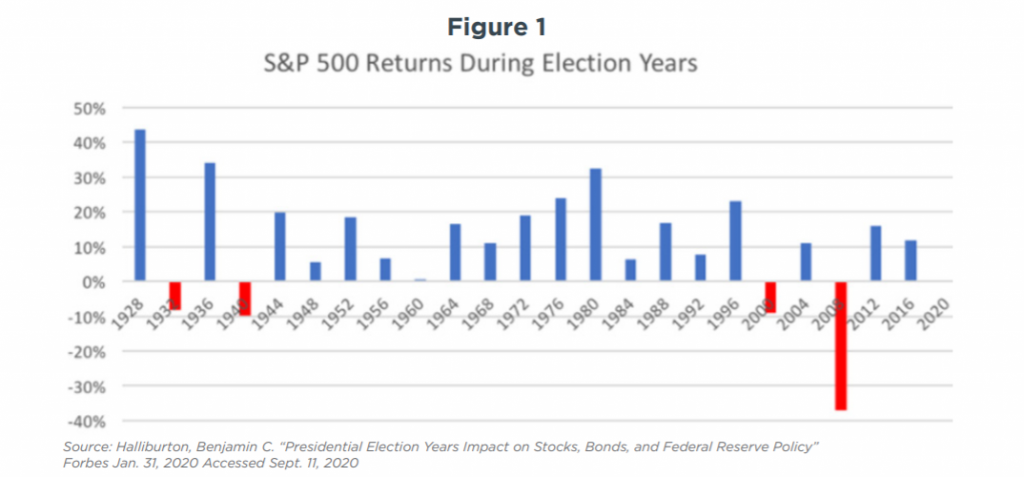
Surely this must have a profound effect on the markets, right? The thing is, it doesn’t. Take, for instance, the annualized market returns of election years. Figure 1 isolates each election year since 1928 to show S&P annual performance. As you’ll see, 19 of those 23 years produced a positive return. In only four of those years, stocks had a negative yearly return. These negative years are pretty easy to account for, by the way:
- 1933: Third year of the Great Depression
- 1940: Germany’s invasion of France during WWII causes panic and a subsequent (but short-lived) crash
- 2000: Stock markets face the dot-com crash
- 2008: Housing crisis kicks off a recession
In other words: the historical market data has clear circumstantial causes outside the election in and of itself.
The insignificance of this particular relationship between investing and politics doesn’t end with election years—far from it. A familiar thought that we see year after year is that the Republican Party is the business party and will foster better returns for the stock market. That same 2020 Hartford survey showed that 47% of respondents believed a Republican presidency would fare better for the stock market as opposed to 37% believing the same of a Democrat.
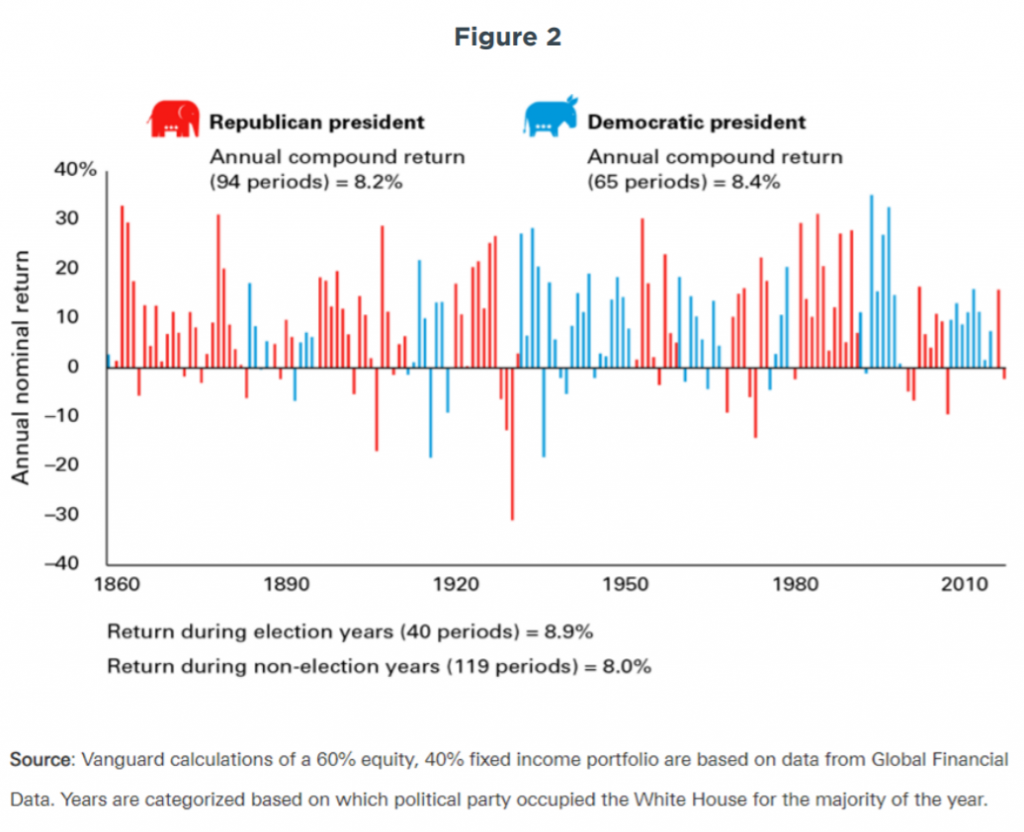
However, the historical difference in returns between Republican and Democratic leadership has been nominal at best. Figure 2 shows the average S&P 500 annual returns were 8.2% under Republican presidents and 8.4% under Democratic presidents since 1860.
S&P Performance Under Each President
If you’re something of a history buff, you might be thinking—yes, but party lines changed dramatically since 1860. Surely if we zoom into modern data, these results would change. They do, but maybe not the way you’d think.
Figure 3 shows the S&P 500 performance under each president since 1929, starting with President Hoover. The average annualized return under Republicans: 2.1%; under Democrats: 10.1%.
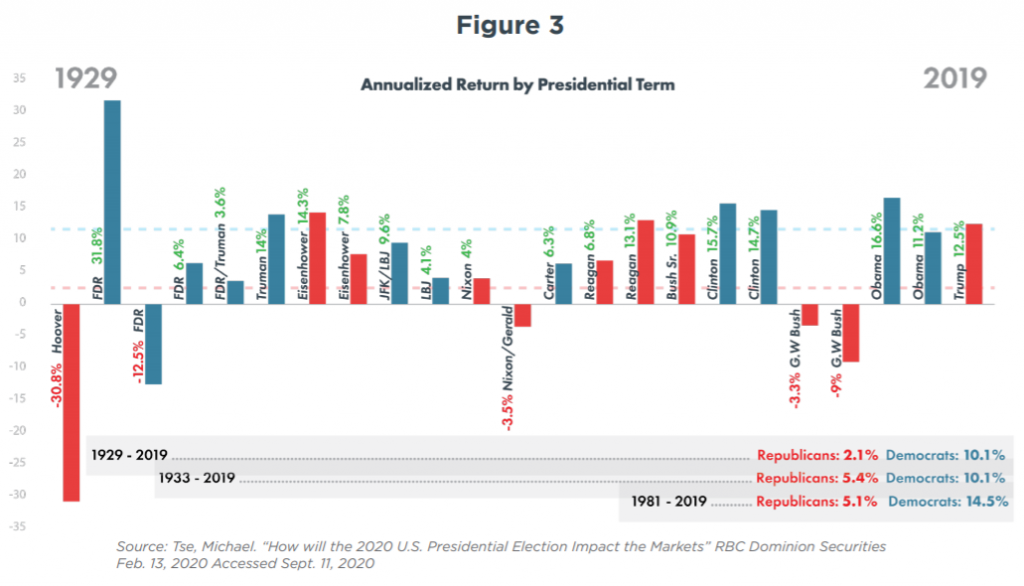
Of course, this average includes the Great Depression under President Hoover. While there are many arguments about what led to that crisis, we won’t hold any party responsible for the single worst financial crisis in American history. So let’s factor out President Hoover out and start in 1933: Republicans: 5.6%, Democrats: 10.1%.
At this point, the term “Reaganomics” might be ringing in your ear. After all, by many standards, Reagan defined the modern Republican Party and led the country through some of its most thriving economic years! But, despite Reagan’s incredible success, if we start averaging from 1981,
when Reagan took office, we find the averages as follows: Republicans: 5.1%, Democrats 14.5%.
The truth is, most of the claims lauding one pro-business party versus one pro-labor party stem from rhetoric, not from data.
No Party Can Claim Economic Mastery
This doesn’t mean the Democratic Party is the gold standard of economic prowess, however. There are many external factors to account for the larger swings across the decades.
For example, the recovery years from the Great Depression spurned massive growth from President Roosevelt that may distort some numbers. And the boom years under President Clinton, followed by the recession caused by September 11 under President George W. Bush, account for a large margin of the spread between these two parties since 1981.
Of course, there are many arguments to claim that Bill Clinton led the country into the boom between 1994 and 1999. However, there’s an equal number of arguments to show that his policies around lending were the root cause of the housing bubble in the first place.
Plenty happens outside the bounds of their leadership, and even the policies and actions that do have a direct effect on the economy may not play out for years after the successive president takes office. A myriad of factors contributed to the boom under Clinton and the bust under Bush. Giving either president total credit for this is an over-estimation of
their power.
The rise of technology, the invention of collateralized debt obligations (CDOs), September 11—these are all major elements over which the sitting president had very little control. Their preparation and reactions to these events matter—without a doubt—but it behooves us to remember how big the world is outside the White House.
Do Political Parties Matter for Investing?
The idea that an investor will perform better under a particular political party is not only inaccurate, it can be harmful to investors.
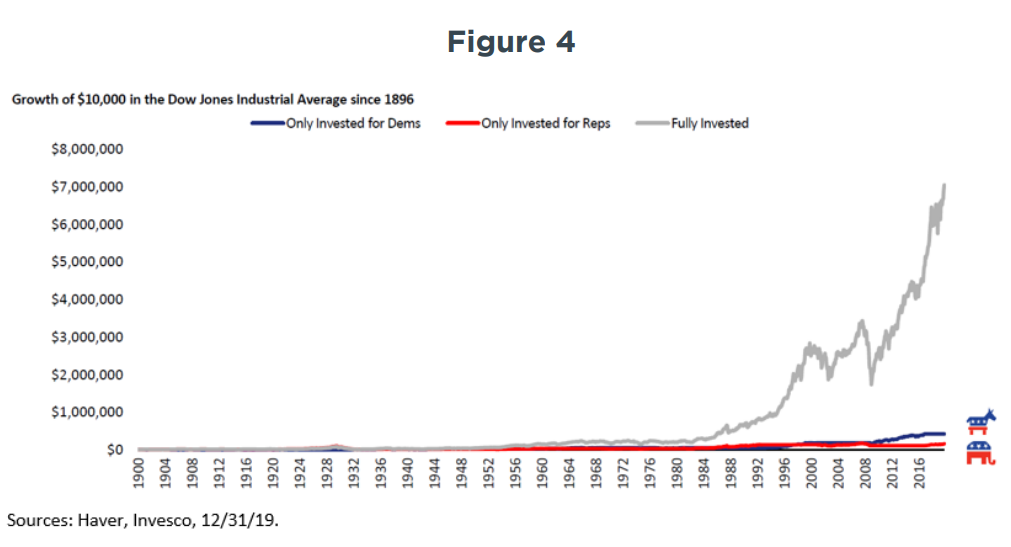
Figure 4 illustrates the hypothetical growth of a $10,000 investment under three scenarios: funds were only invested during democratic leadership, funds were only invested during republican leadership, and finally, funds stayed fully invested since 1896 under all leaders. As you can see, staying fully invested regardless of political party out-performs this type of “selective” investing in spades.
There’s simply nothing to imply that it’s inherently riskier to stay invested during an election year or during the term of any particular political party. Such thoughts are emotion-driven, and emotions are no friend to investors.
Of course, this chart pertains only to investors who believe they should stay invested for a certain political party over another, which would call for long-term exits and reentries into the market. But what about short-term volatility?
Timing the Market
There are many events (as opposed to candidates) that can rock the boat temporarily. Some investors subscribe to the idea that “timing the market” around these events can help save them from volatility or even help them turn a greater profit than staying invested full-time. However, as we will see, even these “short-term” market exists can cost investors dearly.
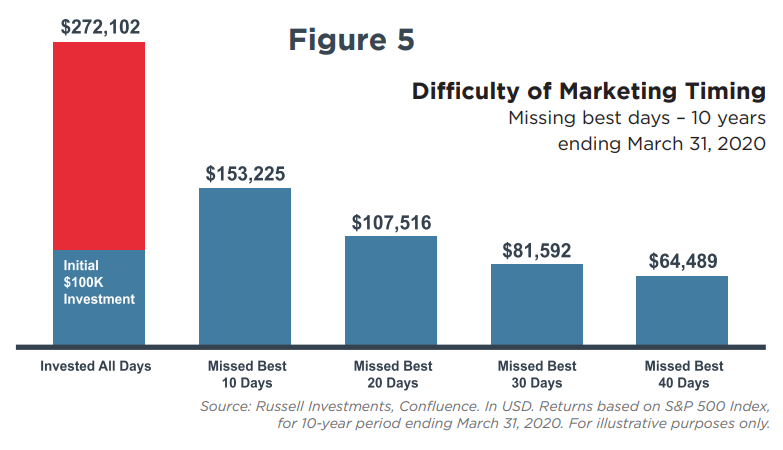
While past performance doesn’t guarantee future results, historically speaking, very good days and very bad days tend to cluster. Therefore, if you exit the market when the going gets tough, you’re likely going to miss the rally that often follows. Figure 5 shows the hypothetical growth of $100,000 invested in the S&P 500 index for a ten-year span between March 2010 and March 2020.
Staying fully invested over this ten-year period would have resulted in gains of $172,102. Missing only the ten best days over this decade would’ve resulted in a profit of only $53,335—a $118,887 difference.
Spoiler alert: it gets worse as you miss more of the market’s best days.
This is the trap that many investors fall into when they begin to think that they can “time” the market.
There are usually three outcomes:
- Unlikely: Investors get lucky selling off when stocks are high and re-entering in perfect unison with the dips of the market, marginally increasing their profits and hopefully without causing themselves any tax issues.
- Very likely: Investors get paralyzed as stocks rally after a short-lived dip, staying out of the market and missing more growth as they wait for an opportunity to “buy low” before re-entering the market.
- Very likely: Investors re-enter the market with higher prices, losing money from their initial sell-off.
It’s simply not prudent for an investor to attempt to time the market, as it’ll most likely cost them in the long term. The bottom line is that despite any political party, global pandemic, or jarring headlines, the best course of action is for clients to stay invested and stick to their long-term financial plan.
Turn Off the Media
If booms, busts, and volatility are not a matter of politics and not a matter of timing, why do we keep hearing endless comparisons and undue blame or credit? The answer is simple: it’s sensational.
News outlets need headlines to pull in viewers—that’s their job. And unfortunately, the idea that corporate profits live and die mostly outside of politics and social issues is just not tantalizing to the American public. So instead, news outlets are forced to compete to top every “panic in the streets” headline they can dream up.
This isn’t a new phenomenon, by the way. The term “yellow journalism” was coined as early as 1890 to describe the preference of sensationalism over cold hard facts in reporting.
A recent example of how this type of reporting affects the market can be demonstrated by the COVID-19 pandemic. Figure 6 shows the performance of the S&P 500 for January through March 2020 and new COVID-19 cases during the same period.
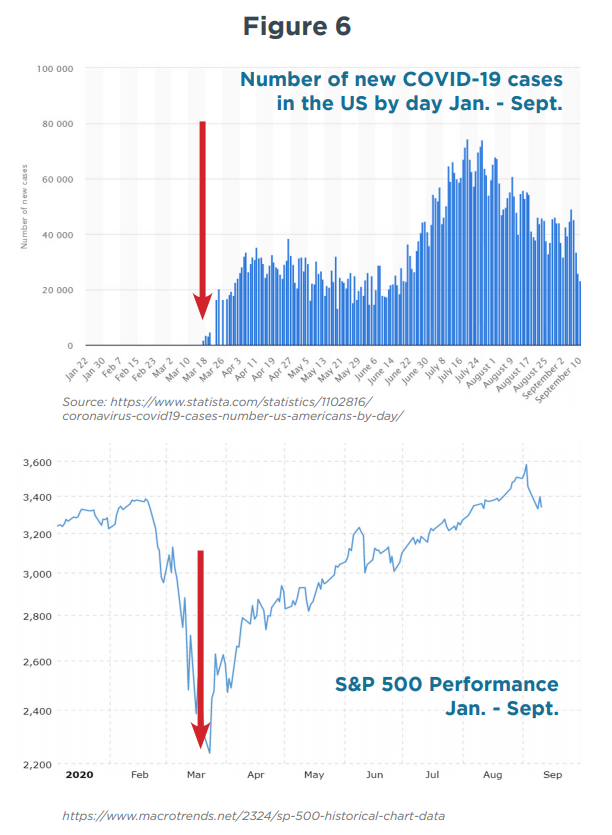
Notice how the market took a nosedive when there were still very few cases of COVID-19 in the US. During the initial weeks of the outbreak, COVID-19 was all over the news, every hour. Pundits predicted a market crash as unemployment was sure to soar and small businesses were predicted to close their doors at historically high rates.
Over the subsequent months, although many of these grim predictions came to fruition, the S&P rapidly recovered—even thrived—despite a steady and alarming rise in confirmed COVID-19 cases. Essentially, the market reacted to the news, not the cases.
By early May, COVID-19 lost its sensationalism. Clearly, it was the news of the virus, not the virus itself, or the number of cases, or the number of deaths that ultimately influenced the market. Had an investor pulled their funds in March, waiting for the “inevitable COVID-19 crash,” they’d have lost a lot of money.
Perhaps there were a lucky few who pulled their funds in February and re-entered the market in March, but even in a casino, there are gamblers who bet against the house and win. They are the exception, not the rule—and they don’t win every time.
The Economy vs. The Markets
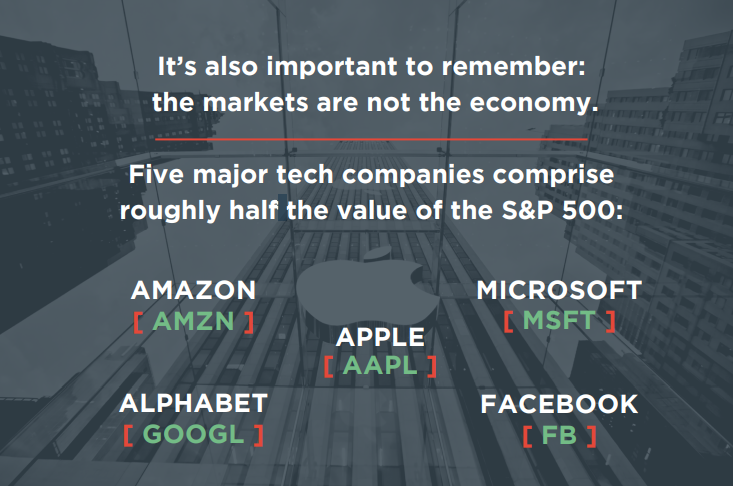
Throughout the pandemic many businesses closed doors, unemployment reached a historical high, and GDP suffered a steep drop—but none of these factors lessened dependency on technology.
Virtual meetings and online ordering took a front seat to what had formerly been viewed as a substitute or a luxury. These industry giants blew all second-quarter earnings expectations out of the water in late July. Amazon rallied the most and sits up 70% year-to-date, Apple follows with a 53% jump, while Microsoft stands 32% higher at the time of this writing.
The sitting president may certainly have influence over corporations, interest rates, lending policies, and many other factors that affect the markets, but it’s the corporate giants (and the thousands that follow their lead) their products, their employees, and their consumers that truly drive the stock market.
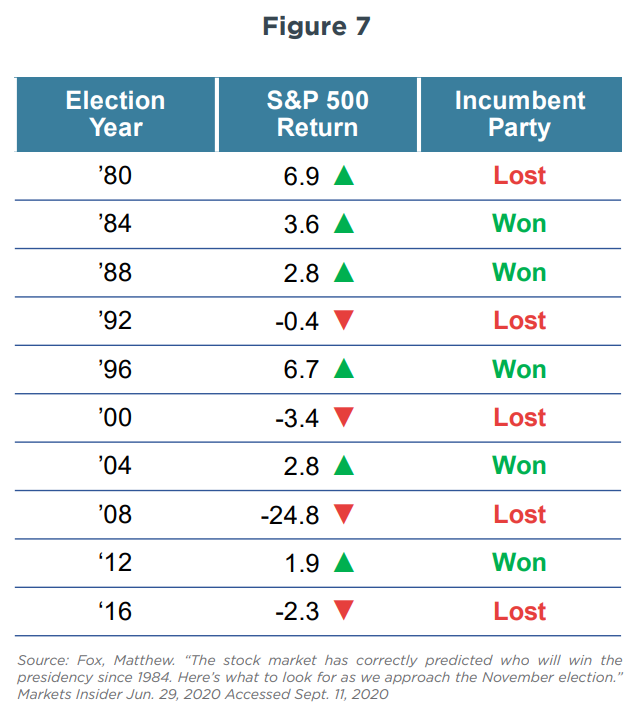
If you’re looking for a relationship between the stock market and politics, there’s one that has proven more reliable than the mainstream claims. Since 1928, the market has called 20 out of 23 presidential elections.
If you’re wondering how this relationship goes, it’s as follows: when stocks are up the months preceding the election, the incumbent party is far more likely to win (87% of the time, to be exact); when stocks are down, the incumbent party is far more likely to lose to the opposing party. You can see how this has played out historically in Figure 7.
The Bottom Line
There are many theories that aim to explain this relationship—perhaps Americans feel that the stock market is a good indicator of a sitting president’s success and more members of the incumbent party are driven to vote in an attempt to continue the trajectory. Perhaps they’re simply in a “better mood” when their stocks are up and less likely to seek change.
Alternatively, it could be that when stocks are down, Americans are driven toward change or are driven to show up in greater numbers in support of the opposing party. Regardless, it appears that despite so many attempts to substantiate that party drives performance, it’s actually the public that uses performance to drive party.
It’ll certainly be interesting to see how the 2020 election results land in this data set. However, rest assured that you can protect your clients by coming up with a solid plan, focusing on investment time horizons, and balancing their risk aversions with the returns they seek.